Planetary protection
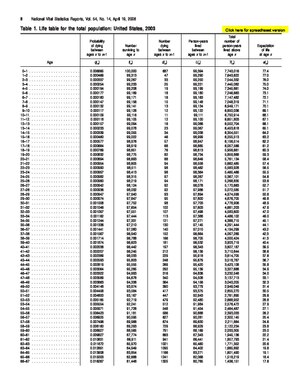
In actuarial science and demography, a life table (also called a mortality table or actuarial table) is a table which shows, for each age, what the probability is that a person of that age will die before his or her next birthday ("probability of death"). From this starting point, a number of inferences can be derived.
- the probability of surviving any particular year of age
- remaining life expectancy for people at different ages
Life tables are also used extensively in biology and epidemiology. The concept is also of importance in product life cycle management.
Background
There are two types of life tables:
- Period or static life tables show the current probability of death (for people of different ages, in the current year)
- Cohort life tables show the probability of death of people from a given cohort (especially birth year) over the course of their lifetime.
Static life tables sample individuals assuming a stationary population with overlapping generations. "Static Life tables" and "cohort life tables" will be identical if population is in equilibrium and environment does not change. "Life table" primarily refers to period life tables, as cohort life tables can only be constructed using data up to the current point, and distant projections for future mortality.
Life tables can be constructed using projections of future mortality rates, but more often they are a snapshot of age-specific mortality rates in the recent past, and do not necessarily purport to be projections. For these reasons, the older ages represented in a life table may have a greater chance of not being representative of what lives at these ages may experience in future, as it is predicated on current advances in medicine, public health, and safety standards that did not exist in the early years of this cohort.
Life tables are usually constructed separately for men and for women because of their substantially different mortality rates. Other characteristics can also be used to distinguish different risks, such as smoking status, occupation, and socioeconomic class.
Life tables can be extended to include other information in addition to mortality, for instance health information to calculate health expectancy. Health expectancies such as disability-adjusted life year and Healthy Life Years are the remaining number of years a person can expect to live in a specific health state, such as free of disability. Two types of life tables are used to divide the life expectancy into life spent in various states:
- Multi-state life tables (also known as increment-decrements life tables) are based on transition rates in and out of the different states and to death
- Prevalence-based life tables (also known as the Sullivan method) are based on external information on the proportion in each state. Life tables can also be extended to show life expectancies in different labor force states or marital status states.
Insurance applications
In order to price insurance products, and ensure the solvency of insurance companies through adequate reserves, actuaries must develop projections of future insured events (such as death, sickness, and disability). To do this, actuaries develop mathematical models of the rates and timing of the events. They do this by studying the incidence of these events in the recent past, and sometimes developing expectations of how these past events will change over time (for example, whether the progressive reductions in mortality rates in the past will continue) and deriving expected rates of such events in the future, usually based on the age or other relevant characteristics of the population. These are called mortality tables if they show death rates, and morbidity tables if they show various types of sickness or disability rates.
The availability of computers and the proliferation of data gathering about individuals has made possible calculations that are more voluminous and intensive than those used in the past (i.e. they crunch more numbers) and it is more common to attempt to provide different tables for different uses, and to factor in a range of non-traditional behaviors (e.g. gambling, debt load) into specialized calculations utilized by some institutions for evaluating risk. This is particularly the case in non-life insurance (e.g. the pricing of motor insurance can allow for a large number of risk factors, which requires a correspondingly complex table of expected claim rates). However the expression "life table" normally refers to human survival rates and is not relevant to non-life insurance.
The mathematics
The basic algebra used in life tables is as follows.
- : the probability that someone aged exactly will die before reaching age .
- : the probability that someone aged exactly will survive to age .


- : the number of people who survive to age

- note that this is based on a radix.,[1] or starting point, of lives, typically taken as 100,000


- : the number of people who die aged last birthday


- : the probability that someone aged exactly will survive for more years, i.e. live up to at least age years


- : the probability that someone aged exactly will survive for more years, then die within the following years


- μx : the force of mortality, i.e. the instantaneous mortality rate at age x, i.e. the number of people dying in a short interval starting at age x, divided by lx and also divided by the length of the interval.
Another common variable is

This symbol refers to Central rate of mortality. It is approximately equal to the average force of mortality, averaged over the year of age.
Ending a Mortality Table
In practice, it is useful to have an ultimate age associated with a mortality table. Once the ultimate age is reached, the mortality rate is assumed to be 1.000. This age may be the point at which life insurance benefits are paid to a survivor or annuity payments cease.
Four methods can be used to end mortality tables:[2]
- The Forced Method: Select an ultimate age and set the mortality rate at that age equal to 1.000 without any changes to other mortality rates. This creates a discontinuity at the ultimate age compared to the penultimate and prior ages.
- The Blended Method: Select an ultimate age and blend the rates from some earlier age to dovetail smoothly into 1.000 at the ultimate age.
- The Pattern Method: Let the pattern of mortality continue until the rate approaches or hits 1.000 and set that as the ultimate age.
- The Less-Than-One Method: This is a variation on the Forced Method. The ultimate mortality rate is set equal to the expected mortality at a selected ultimate age, rather 1.000 as in the Forced Method. This rate will be less than 1.000.
Epidemiology
In epidemiology and public health, both standard life tables to calculate life expectancy and Sullivan and multistate life tables to calculate health expectancy are commonly used. The latter include information on health in addition to mortality.
See also
- Age-adjusted life expectancy
- Actuarial present value
- Decrement table
- Gompertz-Makeham law of mortality
- Strategies for Engineered Negligible Senescence
- Survival analysis
- Service life
Notes
43 year old Petroleum Engineer Harry from Deep River, usually spends time with hobbies and interests like renting movies, property developers in singapore new condominium and vehicle racing. Constantly enjoys going to destinations like Camino Real de Tierra Adentro.
References
- 20 year-old Real Estate Agent Rusty from Saint-Paul, has hobbies and interests which includes monopoly, property developers in singapore and poker. Will soon undertake a contiki trip that may include going to the Lower Valley of the Omo.
My blog: http://www.primaboinca.com/view_profile.php?userid=5889534 - Template:Cite web
- 20 year-old Real Estate Agent Rusty from Saint-Paul, has hobbies and interests which includes monopoly, property developers in singapore and poker. Will soon undertake a contiki trip that may include going to the Lower Valley of the Omo.
My blog: http://www.primaboinca.com/view_profile.php?userid=5889534Template:Page needed
External links
- Canadian Human Mortality Database
- UK Government Actuary Department's Interim Life Tables
- Actuarial Life Table from the U.S. Social Security department
- US CDC Vital Statistics Reports
- Ehemu Database
- Human Mortality Database
- World Health Organisation Life Tables
- Rates in the Cloud Life Tables Generator