File:Bruesselator.svg
Jump to navigation
Jump to search

Size of this PNG preview of this SVG file: 744 × 580 pixels. Other resolutions: 308 × 240 pixels | 616 × 480 pixels | 985 × 768 pixels | 1,280 × 998 pixels | 2,560 × 1,996 pixels.
Original file (SVG file, nominally 744 × 580 pixels, file size: 233 KB)
Summary
| Description |
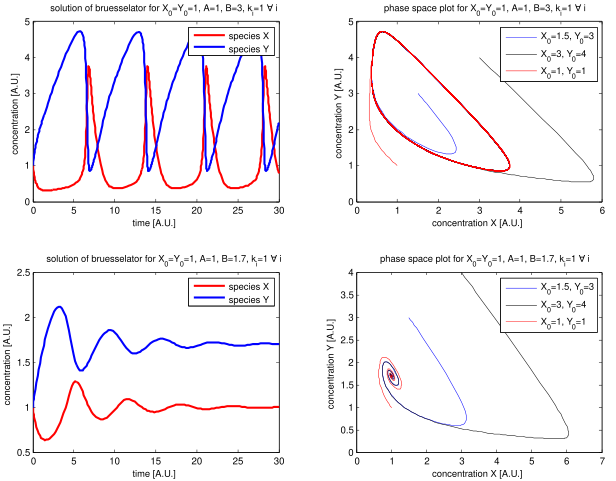
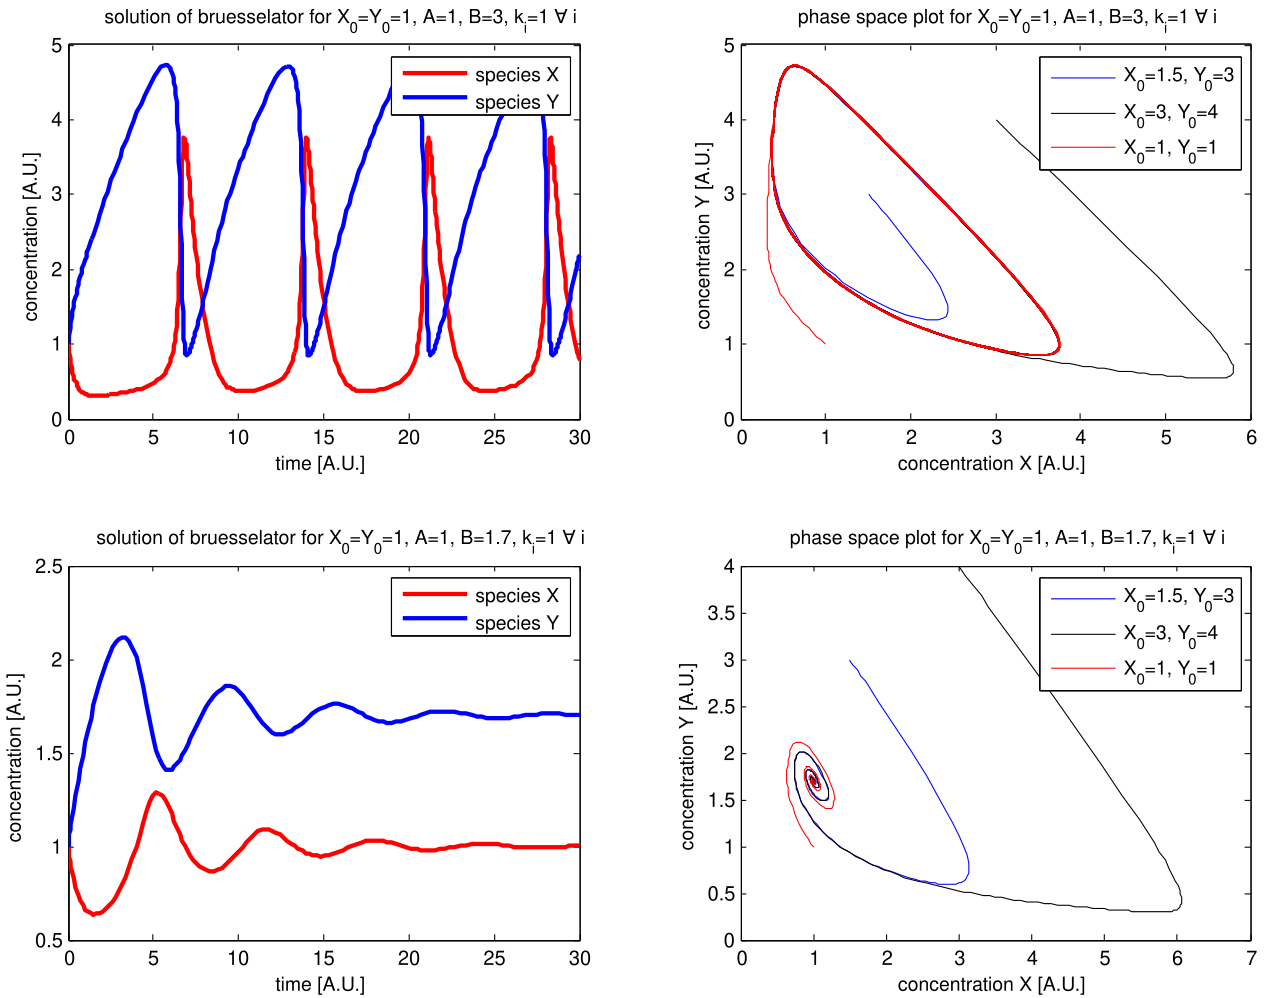
English: solution of "brusselator" differential equations for different conditions |
| Date | |
| Source | Own work |
| Author | Jkrieger |
| Other versions | File:bruesselator_de.svg |
Source Code
Source code
MATLAB code
function bruesselator_time()
clear;
% timestep
DeltaT=0.1;
% reaction constants
k1=1;
k2=1;
k3=1;
k4=1;
% initial concentrations
X0=1;
Y0=1;
% constant concentrations
A=1;
B=3;


figure(1)
subplot(2,2,1)
options = odeset('RelTol',1e-4,'AbsTol',[1e-4 1e-4]);
f=@(t,y) bruesselator(t,y,k1,k2,k3,k4,A,B);
[T,Y] = ode45(f,[0 30],[X0 Y0],options);

plot (T,Y(:,1),'r-', 'LineWidth',2)
hold on
plot(T,Y(:,2),'b-', 'LineWidth',2)
hold off
xlabel('time [A.U.]');
ylabel('concentration [A.U.]');
legend('species X', 'species Y');
title('solution of bruesselator for X_0=Y_0=1, A=1, B=3, k_i=1 \forall i');

subplot(2,2,2)
[T,Y] = ode45(f,[0 200],[1 1],options);
[T,Y1] = ode45(f,[0 200],[1.5 3],options);
[T,Y2] = ode45(f,[0 200],[3 4],options);
plot(Y1(:,1),Y1(:,2), 'b-');
hold on
plot(Y2(:,1),Y2(:,2), 'k-');
plot(Y(:,1),Y(:,2), 'r-');
hold off
legend('X_0=1.5, Y_0=3', 'X_0=3, Y_0=4', 'X_0=1, Y_0=1')
xlabel('concentration X [A.U.]');
ylabel('concentration Y [A.U.]');
title('phase space plot for X_0=Y_0=1, A=1, B=3, k_i=1 \forall i');


A=1;
B=1.7;


subplot(2,2,3)
options = odeset('RelTol',1e-4,'AbsTol',[1e-4 1e-4]);
f=@(t,y) bruesselator(t,y,k1,k2,k3,k4,A,B);
[T,Y] = ode45(f,[0 30],[X0 Y0],options);

plot (T,Y(:,1),'r-', 'LineWidth',2)
hold on
plot(T,Y(:,2),'b-', 'LineWidth',2)
hold off
xlabel('time [A.U.]');
ylabel('concentration [A.U.]');
legend('species X', 'species Y');
title('solution of bruesselator for X_0=Y_0=1, A=1, B=1.7, k_i=1 \forall i');

subplot(2,2,4)
[T,Y] = ode45(f,[0 200],[1 1],options);
[T,Y1] = ode45(f,[0 200],[1.5 3],options);
[T,Y2] = ode45(f,[0 200],[3 4],options);
plot(Y1(:,1),Y1(:,2), 'b-');
hold on
plot(Y2(:,1),Y2(:,2), 'k-');
plot(Y(:,1),Y(:,2), 'r-');
hold off
legend('X_0=1.5, Y_0=3', 'X_0=3, Y_0=4', 'X_0=1, Y_0=1')
xlabel('concentration X [A.U.]');
ylabel('concentration Y [A.U.]');
title('phase space plot for X_0=Y_0=1, A=1, B=1.7, k_i=1 \forall i');

end


function dy = bruesselator(t,y,k1,k2,k3,k4,A,B)
    dy = zeros(2,1);    % a column vector
    dy(1) = k1*A - k2*B*y(1) + k3*y(1)*y(1)*y(2) - k4*y(1);
    dy(2) = k2*B*y(1) -k3*y(1)*y(1)*y(2);
end
Licensing
This file is licensed under the Creative Commons Attribution 3.0 Unported license.
Attribution: Jan Krieger
- You are free:
- to share – to copy, distribute and transmit the work
- to remix – to adapt the work
- Under the following conditions:
- attribution – You must give appropriate credit, provide a link to the license, and indicate if changes were made. You may do so in any reasonable manner, but not in any way that suggests the licensor endorses you or your use.
File history
Click on a date/time to view the file as it appeared at that time.
| Date/Time | Thumbnail | Dimensions | User | Comment | |
|---|---|---|---|---|---|
| current | 19:37, 4 August 2012 | | 744 × 580 (233 KB) | wikimediacommons>Jkrieger | {{Information |Description ={{en|1=solution of "brusselator" differential equations for different conditions}} |Source ={{own}} |Author =Jkrieger |Date =2012-08-04 |Permission = |other_versions =[[:Fil... |
File usage
There are no pages that use this file.