File:Butterworth filter bode plot.svg

Original file (SVG file, nominally 1,250 × 875 pixels, file size: 31 KB)
Summary
| Description |
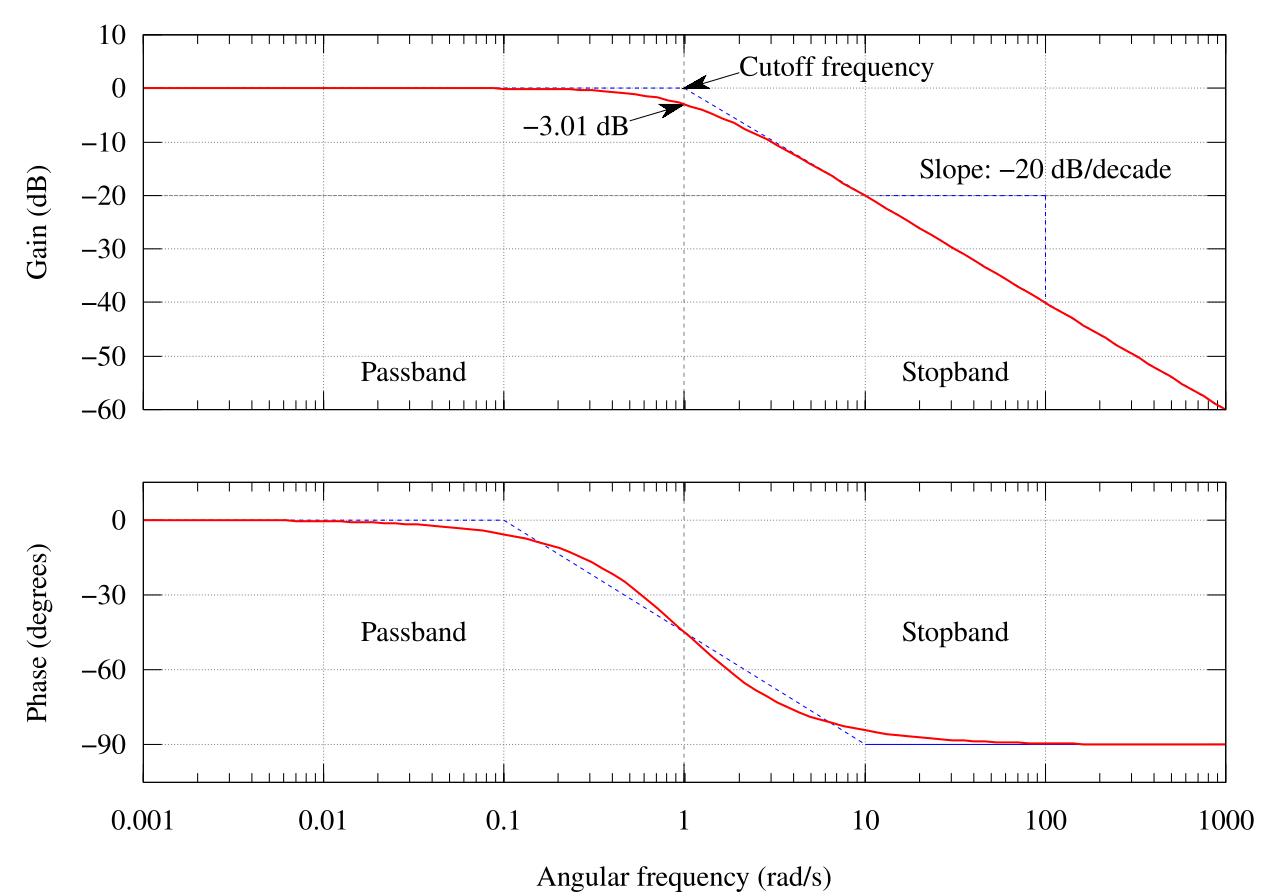
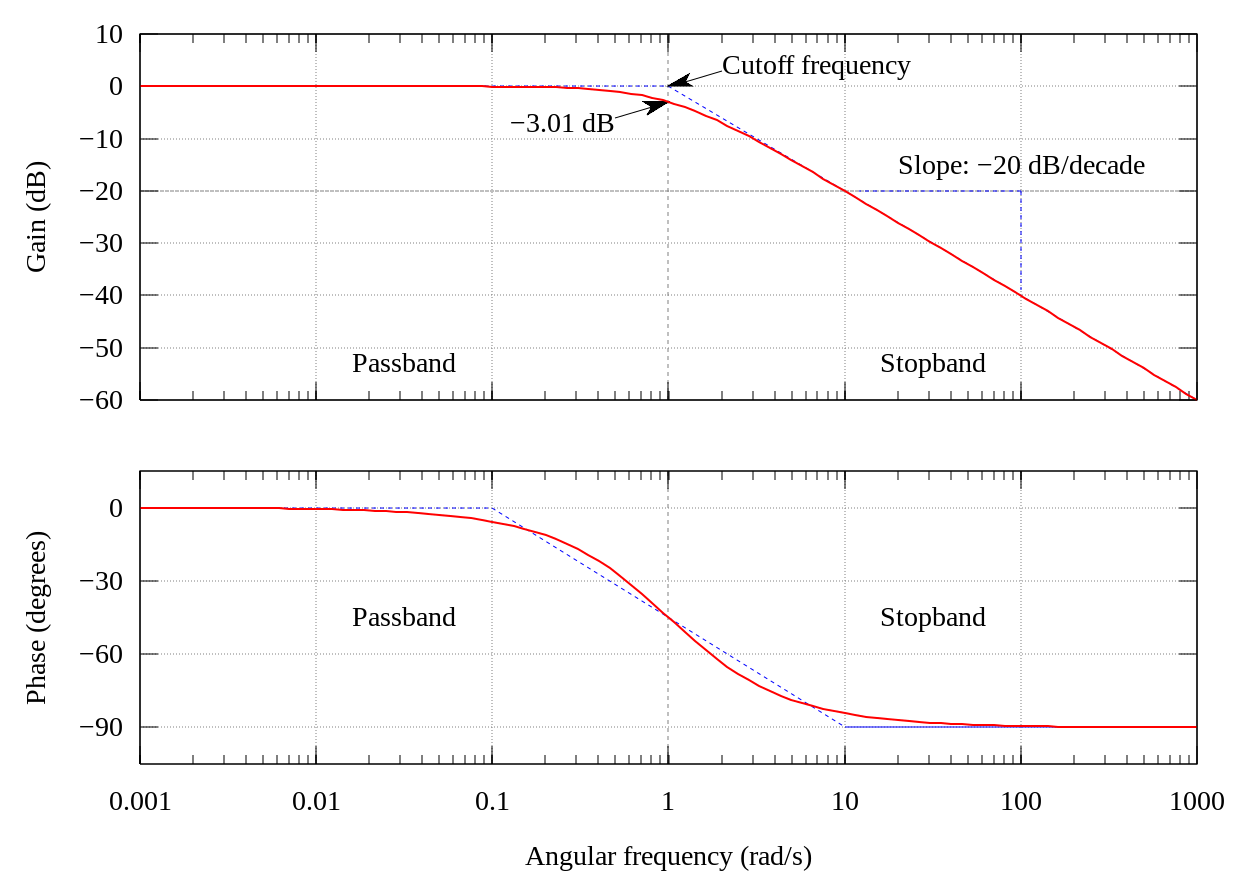
English: The Bode plot of a Butterworth filter with logarithmic axes and various labels. Cutoff frequency is normalized to 1 rad/s. Gain is normalized to 0 dB in the passband. Phase is in degrees because that's typical.
The code is kind of kludgy, but makes a good output. Generated in gnuplot with the script below (save as butterworth_bode_plot.plt and then open in gnuplot). Then it was postprocessed with Inkscape. See Wikipedia graph-making tips. Many orders on one plot: Image:Butterworth orders.png
|
||
| Date | 26 April 2006 (upload date) | ||
| Source | Own work | ||
| Author | Alejo2083 | ||
| Other versions |
[]
.png:
|
||
| gnuplot source | click to expand
set terminal svg enhanced size 1250 875 fname "Times" fsize 25
set output "Butterworth_filter_bode_plot.svg"

# Butterworth amplitude response and decibel calculation.  n is the order, which is just 1 in this image.
G(w,n) = 1 / (sqrt(1 + w**(2*n)))
dB(x) = 20 * log10(abs(x))
# Phase is for first order
P(w) = -atan(w)*180/pi


# Gridlines
set grid

# Set x axis to logarithmic scale
set logscale x 10

# No need for a key
set nokey #0.1,-25

# Frequency response's line plotting style
set style line 1 lt 1 lw 2

# Asymptote lines and slope lines are the same "arrow" style
set style line 3 lt 3 lw 1
set style arrow 3 nohead ls 3

# -3 dB arrow style
set style line 4 lt 4 lw 1
set style arrow 4 head filled size screen 0.02,15,45 ls 4

# Separator between passband and stopband line style
set style line 2 lt 2 lw 1
set style arrow 2 nohead ls 2


set multiplot

# Magnitude response
# =============================================
set size 1,0.5
set origin 0,0.5

# Set range of x and y axes
set xrange [0.001:1000]
set yrange [-60:10]

# Create x-axis tic marks once per decade (every multiple of 10)
set xtics 10
#set ytics 10

# No need for two sets of numbers
set format x ""

# Use 10 x-axis minor divisions per major division
set mxtics 10

# Axis labels
set ylabel "Gain (dB)"

# Draw asymptote lines
set arrow 1 from 1,0 to 1000,-60 as 3
set arrow 2 from .001,0 to 1,0 as 3

# -3 dB arrow
set arrow 4 from 2,3 to 1,0 as 4

# "Cutoff frequency" label uses same coordinates as the function
set label 3 "Cutoff frequency" at 2,4 l

# "-3 dB" label
set arrow 5 from 0.5,-6 to 1,-3 as 4
set label 4 "-3.01 dB" at 0.5,-7 r

# Draw a separator between passband and stopband and label them
set arrow 3 from 1,-60 to 1,10 as 2

# Label coordinates are relative to the graph window, not to the function, centered at the 1/4 and 3/4 width points
set label 1 "Passband" at graph 0.25, graph 0.1 c
set label 2 "Stopband" at graph 0.75, graph 0.1 c

# Draw slope lines and label
set arrow 6 from 100,-20 to 12,-20 as 3
set arrow 7 from 100,-20 to 100,-39 as 3
set label 5 "Slope: -20 dB/decade" at 100,-15 c

plot dB(G(x,1)) ls 1  title "1st-order response"


#Phase response
# =============================================
set size 1,0.5
set origin 0,0

# Set range of x and y axes
set yrange [-105:15]

# Create y-axis tic marks every 15 degrees
set ytics 30

# Regular numbers
set format x "% g"

# Axis labels
set ylabel "Phase (degrees)"
set xlabel "Angular frequency (rad/s)"

# Draw asymptote lines
set arrow 1 from 0.1,0 to 10,-90 as 3
set arrow 2 from 0.001,0 to 0.1,0 as 3
set arrow 10 from 10,-90 to 1000,-90 as 3

# -3 dB arrow
unset arrow 4 #from 2,3 to 1,0 as 4

# "Cutoff frequency" label uses same coordinates as the function
unset label 3 #"Cutoff frequency" at 2,4 l

# "-3 dB" label
unset arrow 5 #from 0.5,-6 to 1,-3 as 4
unset label 4 #"-3.01 dB" at 0.5,-7 r

# Draw a separator between passband and stopband and label them
set arrow 3 from 1,-105 to 1,15 as 2

# Label coordinates are relative to the graph window, not to the function, centered at the 1/4 and 3/4 width points
set label 1 "Passband" at graph 0.25, graph 0.5 c
set label 2 "Stopband" at graph 0.75, graph 0.5 c

# Draw slope lines and label
unset arrow 6 #from 100,-20 to 12,-20 as 3
unset arrow 7 #from 100,-20 to 100,-39 as 3
unset label 5 #"Slope: -20 dB/decade" at 100,-18 c

plot P(x) ls 1 title "Phase response"


unset multiplot
|


|
A raster version of this image is available. It should be used in place of this vector image when superior.
File:Butterworth filter bode plot.svg → File:Butterworth filter bode plot.png
In general, it is better to use a good SVG version. |
 |
Licensing

|
Permission is granted to copy, distribute and/or modify this document under the terms of the GNU Free Documentation License, Version 1.2 or any later version published by the Free Software Foundation; with no Invariant Sections, no Front-Cover Texts, and no Back-Cover Texts. A copy of the license is included in the section entitled GNU Free Documentation License. |
| This file is licensed under the Creative Commons Attribution-Share Alike 3.0 Unported license. | ||
| ||
| This licensing tag was added to this file as part of the GFDL licensing update. |
- You are free:
- to share – to copy, distribute and transmit the work
- to remix – to adapt the work
- Under the following conditions:
- attribution – You must give appropriate credit, provide a link to the license, and indicate if changes were made. You may do so in any reasonable manner, but not in any way that suggests the licensor endorses you or your use.
- share alike – If you remix, transform, or build upon the material, you must distribute your contributions under the same or compatible license as the original.
File history
Click on a date/time to view the file as it appeared at that time.
| Date/Time | Thumbnail | Dimensions | User | Comment | |
|---|---|---|---|---|---|
| current | 04:39, 12 October 2023 | | 1,250 × 875 (31 KB) | wikimediacommons>Mikhail Ryazanov | +ru translation |
File usage
There are no pages that use this file.