File:Some log-normal distributions.svg
Jump to navigation
Jump to search

Size of this PNG preview of this SVG file: 593 × 561 pixels. Other resolutions: 254 × 240 pixels | 507 × 480 pixels | 812 × 768 pixels | 1,082 × 1,024 pixels | 2,165 × 2,048 pixels.
Original file (SVG file, nominally 593 × 561 pixels, file size: 65 KB)

|
This file has been superseded by PDF-log normal distributions.svg. It is recommended to use the other file. Please note that deleting superseded images requires consent.
|

|
Summary
| Description |
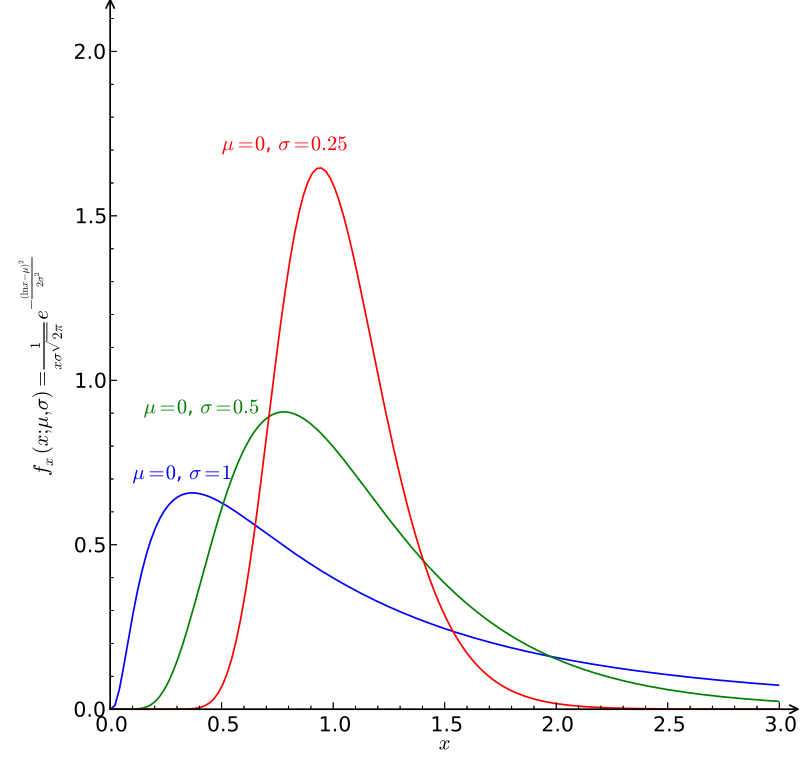
English: Some log-normal distributions. |
| Date | |
| Source | Own work |
| Author |
 |
W3C-validity not checked.
| Source Code |
|---|
from numpy import *
from matplotlib.pyplot import *
from mpl_toolkits.axes_grid.axislines import SubplotZero

pdf = lambda s,m,x: exp(-(log(x)-m)**2 / (2.*s**2)) / ( x*sqrt(2.*pi*s**2) )

fig = figure(figsize=(7,7))
ax = SubplotZero(fig,111)
fig.add_subplot(ax)

for direction in ["xzero","yzero"]:
        ax.axis[direction].set_visible(True)
        ax.axis[direction].set_axisline_style("->")
for direction in ["top","bottom","left","right"]:
        ax.axis[direction].set_visible(False)
ax.axis["yzero"].set_axis_direction("left")
ax.grid(False)
ax.minorticks_on()

x = linspace(.001,3,150)
ax.plot(x,pdf(1.,0.,x))
ax.text(.1,.7,r'$\mu=0$, $\sigma=1$',color='b')

ax.plot(x,pdf(.5,0.,x),'g')
ax.text(.15,.9,r'$\mu=0$, $\sigma=0.5$',color='g')

ax.plot(x,pdf(.25,0.,x),'r')
ax.text(.5,1.7,r'$\mu=0$, $\sigma=0.25$',color='r')

ax.set_ylim(0,2.1)
ax.set_xlim(0,3)

ax.axis["xzero"].label.set_text(r'$x$')
ax.axis["yzero"].label.set_text(r'$f_x(x;\mu,\sigma)=\frac{1}{x\sigma\sqrt{2\pi}}e^{-\frac{\left(\ln x-\mu\right)^2}{2\sigma^2}}$')

fig.savefig("Test.svg",bbox_inches="tight",pad_inches=.15)
|
Licensing
I, the copyright holder of this work, hereby publish it under the following licenses:
This file is licensed under the Creative Commons Attribution-Share Alike 3.0 Unported license.
- You are free:
- to share – to copy, distribute and transmit the work
- to remix – to adapt the work
- Under the following conditions:
- attribution – You must give appropriate credit, provide a link to the license, and indicate if changes were made. You may do so in any reasonable manner, but not in any way that suggests the licensor endorses you or your use.
- share alike – If you remix, transform, or build upon the material, you must distribute your contributions under the same or compatible license as the original.

|
Permission is granted to copy, distribute and/or modify this document under the terms of the GNU Free Documentation License, Version 1.2 or any later version published by the Free Software Foundation; with no Invariant Sections, no Front-Cover Texts, and no Back-Cover Texts. A copy of the license is included in the section entitled GNU Free Documentation License. |
You may select the license of your choice.
File history
Click on a date/time to view the file as it appeared at that time.
| Date/Time | Thumbnail | Dimensions | User | Comment | |
|---|---|---|---|---|---|
| current | 20:41, 20 September 2011 | | 593 × 561 (65 KB) | wikimediacommons>Krishnavedala | A smaller version with the same information created using python, numpy and matplotlib. |
File usage
There are no pages that use this file.