File:Spectral leakage from a sinusoid and rectangular window.png
Jump to navigation
Jump to search
No higher resolution available.
Spectral_leakage_from_a_sinusoid_and_rectangular_window.png (508 × 412 pixels, file size: 47 KB, MIME type: image/png)
Transferred from en.wikipedia to Commons by Maksim.
The original description page was here. All following user names refer to en.wikipedia.
Summary
| Description |
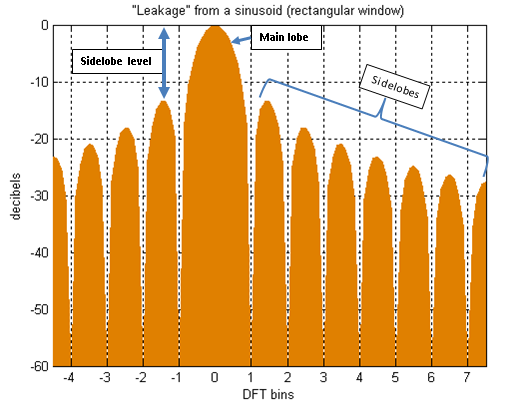
English: This is a portion of the DTFT for a rectangularly-windowed sinusoid. The actual frequency of the sinusoid is indicated as "0" on the horizontal axis. Everything else is leakage. The unit of frequency is "DFT bins"; that is, the integer values on the frequency axis correspond to the frequencies sampled by the DFT. So the figure depicts a case where the actual frequency of the sinusoid happens to coincide with a DFT sample, and the maximum value of the spectrum is accurately measured by that sample. When it misses the maximum value by some amount [up to 1/2 bin], the measurement error is referred to as scalloping loss (inspired by the shape of the peak). But the most interesting thing about this case is that all the other samples coincide with nulls in the true spectrum. (The nulls are actually zero-crossings.) So in this case, the DFT creates the illusion of no leakage. |
|||
| Date | ||||
| Source | Own work I created this image myself, using Matlab tools and PowerPoint to annotate the graph and create a png file. | |||
| Author | Bob K | |||
| Permission (Reusing this file) |
|
|||
| Other versions |
|
|||
| Script | Matlab codeN=128;
k=0:N-1;
dr = 60;
w = ones(1,N);
%
H = abs(fft([w zeros(1,7*N)]));
H = fftshift(H);
H = H/max(H);
H = 20*log10(H);
H = max(-dr,H);
x = -4.5*8 : 7.5*8;
H = H(x + 1+4*N);
%
figure
h = area(x/8,H,'FaceColor', [.871 .49 0], 'Linestyle', 'none')
set(h,'BaseValue',-dr)
ylim([-dr 0])
set(gca,'XTick', -4:7)
grid on
ylabel('decibels')
xlabel('DFT bins')
title('"Leakage" from a sinusoid (rectangular window)')
|


|
This image (or all images in this category) uses inside labels or attached captions in a specific script or language and should be converted to a language neutral form. This would allow its use in all Wikimedia projects and, more importantly, all Wikimedia languages.
|
| date/time | username | edit summary |
|---|---|---|
| 01:47, 17 December 2005 | en:User:Bob K | (I created this image myself, using Matlab tools.) |
File history
Click on a date/time to view the file as it appeared at that time.
| Date/Time | Thumbnail | Dimensions | User | Comment | |
|---|---|---|---|---|---|
| current | 07:25, 17 December 2011 | | 508 × 412 (47 KB) | wikimediacommons>Bob K | Remove gray border. Annotate sidelobes, main lobe, sidelobe level. |
File usage
There are no pages that use this file.